New Releases × BSR Cross-Analysis: Is There Still Room for a Newcomer on Amazon?
Here's how most people do Amazon product opportunity analysis: open a category, look at how much the top sellers are moving, see a few thousand reviews on each listing, and then either get scared off or jump in on a hunch. Both roads can lose you money.
High sales volume only tells you the demand exists. It doesn't answer the question that actually decides whether you make money: does this market still let new sellers in? Some categories have a BSR top 100 made entirely of listings that launched three years ago with tens of thousands of reviews. You walk in there to prop them up. Other categories look average on volume, but every month new listings are punching into the rankings, which means the water isn't fully muddied and a newcomer has a shot. On a sales chart those two markets look identical. To you they are night and day.
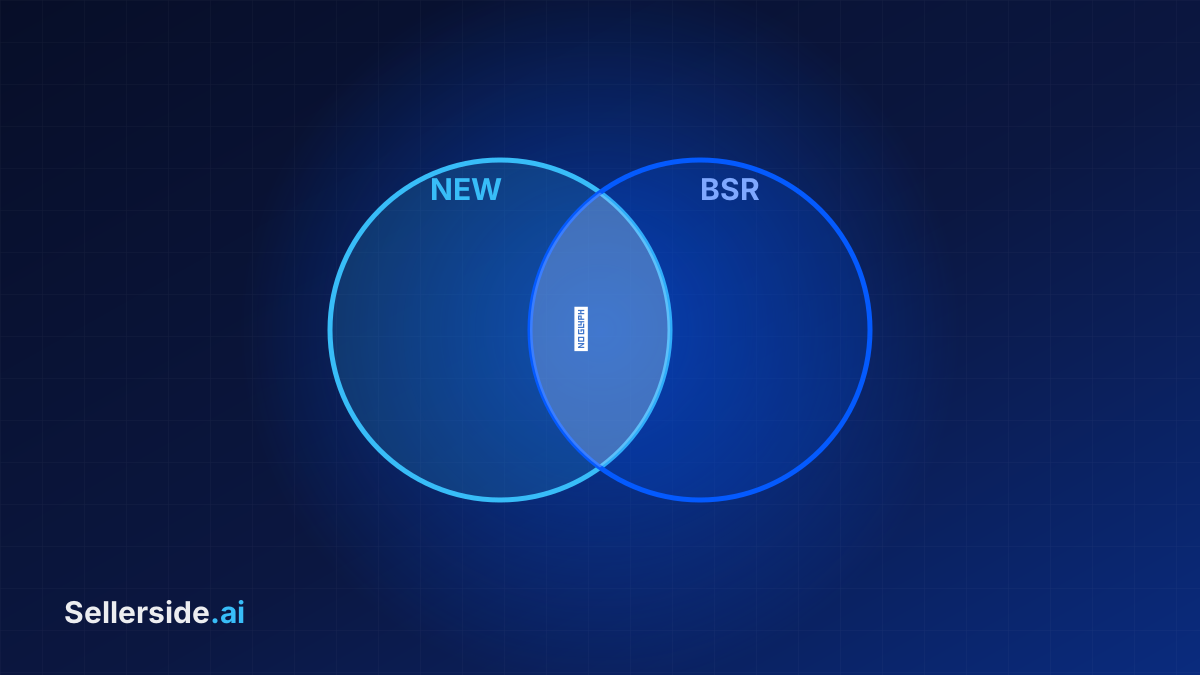
To tell them apart, I lean on a crude but reliable trick: stack the New Releases list on top of the BSR list and see where they overlap. Here's how to run it.
Start with one number: how big is the intersection
Every Amazon category has two rankings. One is the Best Sellers Rank (BSR), which reflects who's selling the most right now. The front of that list is mostly seasoned listings. The other is New Releases, which only holds recently launched listings and reflects which newcomers are breaking out.
Take the top 100 of each and count how many ASINs show up on both. That intersection count is your market's vitality signal. You can call it a monopoly index, read in reverse:
- Intersection = 0. Not a single recently launched product cracked the best-seller top 100. The incumbents have the positions bolted down and newcomers can't climb in. This one says walk away, unless you're holding a card nobody else has.
- Intersection ≥ 5. Five or more new listings have already fought their way into the BSR top 100. The market rewards newcomers. Put in the work and you'll get seen.
- In between. One or two means the door is ajar. Whether you can pry it open depends on whether you've got real differentiation.
This number is a lot more honest than volume alone. Volume tells you how big the cake is. The intersection tells you whether the cake can still be cut.
A made-up example: in a kitchen-gadget category, the highest-selling listings in the BSR top 100 all launched in 2021, and the top new listing in New Releases sits past rank 300 in BSR, with none of them breaking the top 100. Intersection of zero. Now you know the problem isn't weak demand, it's that the seats are taken. Flip it around: a pet-supplies sub-niche where seven or eight New Releases listings have already reached the BSR top 100. That tells you people have been eating well off new products here in the last six months. That's where your time belongs.
Then read the market: is this category turning over?
One snapshot of the intersection isn't enough. You want to feel the market's rhythm. A simple read: of the listings sitting near the front of the best-seller list, how many launched recently?
If most of the BSR front-runners went live in the last six to twelve months, the market is turning over fast, the pecking order isn't settled, and there's a window. If the front is wall-to-wall listings that are several years old with reviews stacked into the thousands, you've got a market that matured into rigidity, and walking in means going head to head with years of accumulated inventory.
Fast-turnover markets usually come with a tell: the top listings swing around in the rankings. A category where the incumbents sit rock-steady tends to be the hardest one to enter.
Watch the dark horses: who's quietly eating with a new product
Those few listings in the intersection, the ones that launched recently and still broke into the best-seller list, are your dark horses. Pull each one out and dissect it.
Check a handful of things: how long it's been live, roughly how much it moves a day, whether it runs variations, and where its title and main image beat the old guard. A listing that reached the BSR top 50 within two months of launch did something right. Maybe it caught a use case the incumbents ignored, maybe it made one small change to packaging or spec. Take it apart and you'll basically know the entry posture this market rewards right now.
A dark horse is the best thing to copy from, because it proves that at this moment, with this playbook, entering works. An old listing can't prove that. Its win might have been a tailwind from three years ago that's long gone today.
Micro-trends: read the wind from the titles
One finer-grained job: line up the title text of the new listings in this category against the old ones, and watch whether the selling-point keywords the newcomers lead with have visibly shifted.
Say the old titles keep hammering one basic feature word, while the recent batch of new listings all quietly added some new material word or use-case word. That's demand drifting in that direction. Note that this is a signal read straight from the title text, not inferred from somewhere else, so its strength is that it's sourced: you can click through and verify listing by listing. It doesn't replace going into the reviews to hear what buyers actually say, but it gives you a hint about which direction to hunt.
Stitch it into one call
No single metric is enough on its own. What you want is to string them into one plain-English conclusion.
The intersection tells you whether the door is open. The turnover speed tells you whether that door is opening wider or about to close. The dark horses tell you how the people already inside got in. The micro-trends tell you which way to walk once you're in. With all four in hand you can finally answer the question you started with: if I enter now, am I too late?
There's no blanket answer to too-late. It comes down to whether you're holding the card that pries the door open a crack: an ignored use case, a spec change, a sub-segment the incumbents can't be bothered with. Cross-analysis lets you quantify "is there still room in this market" down to something you can decide on. The differentiation that follows, you have to go dig out of the reviews.
If you'd rather skip manually scraping both lists, counting the intersection, and hunting the dark horses, you can generate a free product report on Sellerside.ai. Type in one category keyword and it works out the New Releases and BSR intersection, the market turnover, and the dark-horse tracking together, so you can look at the real data and make the call yourself.